雙標圖
外觀

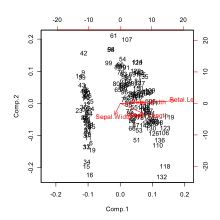
雙標圖(Biplots)是一類統計學的統計圖形。雙標圖可以同時把抽樣和資料矩陣變量中的數據用圖表表示出來。抽樣樣本可以用向量、線性軸和非線性軌跡表達。在類別變量的案例中,類別水平點(category level points)可以用來代表其類別變量的水平值。一類廣義的雙標圖可以適用呈現序數純量和區間純量。
相關資料
[編輯]- Gabriel, K.R. The biplot graphic display of matrices with application to principal component analysis. Biometrika. 1971, 58 (3): 453–467.
- Gower, J.C., Hand, D.J, 1996. Biplots. Chapman & Hall, London, UK. ISBN 0412716305
- Yan, W., Kang, M.S. 2003. GGE Biplot Analysis. CRC Press, Boca Raton, FL. ISBN 0849313384
- Vicente-Villardón, J.L.; Galindo M.P., Blázquez-Zaballos, A. (2006). Logistic Biplots. In: Multiple correspondence analysis and related methods. Greenacre M.; Blasius, J. (Eds) Chapman & Hall/CRC Press. Boca de Raton. USA. 608 p. ISBN 1584886285
- Demey JR, JL Vicente-Villardón, MP Galindo-Villardón, AY Zambrano. 2008. Identifying molecular markers associated with classification of genotypes by External Logistic Biplots. Bioinformatics. 24(24):2832-2838
| 這是一篇與統計學相關的小作品。您可以透過編輯或修訂擴充其內容。 |

